Examining Multi-ROIs with the Measurement Inspector
The Measurement Inspection panel lets you plot the statistical properties of a multi-ROI on a histogram and then highlight the selected range in the 2D
To open the Measurement Inspector, shown below, right-click a multi-ROI and then choose Measurement Inspector in the pop-up menu.
Measurement Inspector

| Description | |
|---|---|
| Object | Lets you select the multi-ROI that you want to examine in the view. |
| Measurement | Lets you select the scalar measurement you want to plot in the histogram and view onscreen. |
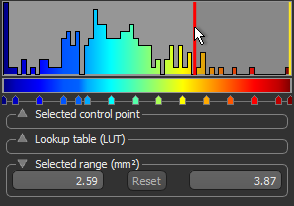
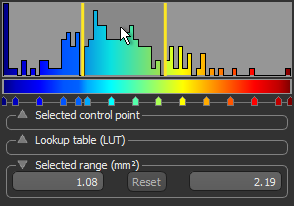
| Measurement range |
Lets you select the minimum and maximum values that you want plotted on the histogram.
|
| Hide out of range measurement |
If selected, discrete objects with scalar values that are outside the range selected in the Measurement range box will be hidden.
If not selected, discrete objects with scalar values that are outside the range selected in the Measurement range box will be colored according to the corresponding minimum or maximum value. |
| Histogram |
Shows how values are distributed in the multi-ROI and lets you adjust the threshold values for the In and Out window rendering options. You can plot the Y axis in log scale, if required.
|
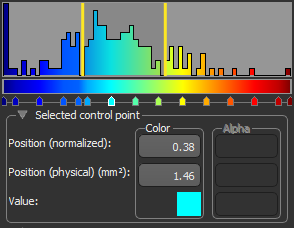
| Select control point |
The normalized position of the control point within the selected window, its physical position (the value to which it corresponds), as well as the control point’s color or colors, are indicated in the Selected control point box, shown below.
Note Refer to the topic Using the LUT Editor for information about editing control points. |
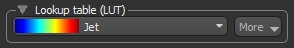
| Lookup table (LUT) |
Options in the Lookup table (LUT) box, shown below, let you choose the LUT function that will be applied to the histogram and view of the selected multi-ROI. Additional options are available in the More drop-down menu.
Note Refer to the topic Using the LUT Editor for information about editing a LUT. |
| Selected range |
Are the minimum and maximum threshold values, which define the In window and Out window ranges.
|
| In window rendering |
Lets you adjust the opacity of the highlight applied to all values within the selected In window range and to create a new multi-ROI that includes all of the labeled objects and their scalar values that correspond to the selected In window rendering range.
Highlight intensity… Determines the intensity of the highlight applied to the In window values in views of the multi-ROI. 3D opacity… Determines the opacity of the In window values in the 3D view of the multi-ROI. Export… Lets you create a new multi-ROI that includes all of the labeled objects that correspond to the selected In window rendering range. Exported multi-ROIs will appear automatically in the Data Properties and Settings panel. |
| Out window rendering |
Lets you adjust the opacity of the highlight applied to all values within the selected Out window range and to create a new multi-ROI that includes all of the labeled objects and their scalar values that correspond to the selected Out window rendering range.
Highlight intensity… Determines the intensity of the highlight applied to the Out window values in views of the multi-ROI. 3D opacity… Determines the opacity of the Out window values in the 3D view of the multi-ROI. Export… Lets you create a new multi-ROI that includes all of the labeled objects that correspond to the selected Out window rendering range. Exported multi-ROIs will appear automatically in the Data Properties and Settings panel. |